For anyone who thought Christmas came early when the Centers for Disease Control and Prevention (CDC) announced its newly created Salmonella Atlas, compiled from 40 years of disease-tracking data, a word of caution. It’s probably not what you think.
If you thought, for example, that with a point and click you’d be able to find out which subtype of Salmonella sickened the most Americans each year, which foods have the highest rates of contamination or which subtypes show the most antibiotic resistance you’d be wrong, wrong, wrong. And don’t look for an explanation of why the subtype profiles contained in the atlas were chosen or any kind of analysis or discussion of findings. The maps are kind of cool, though.
There are more than 2,500 subtypes of Salmonella, not much is known about most of them and the atlas breaks no new ground there. Most cases of Salmonella infection are causes by 100 subtypes, the 32 subtypes profiled in the atlas were, presumably, chosen because they are the ones the agency had the data on. The ones that have caused disease over the last 40 years.
Each profile has two pages of graphs and five maps. The graphs show the following information: Rate of Isolates Per 100,000 Population -fun activity, find the U.S. population for each of the last 40 years and do the math for all 32 isolates! Percentage of Reported Isolates by Specimen Source- stool sample is the big winner here. Percentage of Isolates Reported By Age Group and Month- the hot poop here is that summer months have higher reports because germs spread faster when, well, the poop is hot. Rate of Reported Isolates By Age Group and Year- there was a huge spike in Salmonella Heidelberg infections among children ages 0-4 during the late 1980s.
Why? Excellent question, answer not provided. Median Age of Persons Whose Specimens Yielded Isolates. Percentage of Reported Isolates By Age Group and Sex- children four and under have the highest percentage of Salmonella Heidelberg infections. Percentage of Non-Human Isolates by animal source in clinical and non-clinical settings- for Salmonella Heidelberg, chicken was the hands down winner accounting for over 50 percent of isolates in clinical settings and more than 73 percent of isolates in non clinical settings.
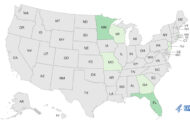
Salmonella Heidelberg is used the example above because it is in the news. It’s the subtype associated with the ongoing Salmonella outbreak attributed to Foster Farms chicken which has sickened at least 481 people in 25 states. The CDC says for each reported cases there are 29.3 others. Using that multiplier, 14,093 people have been sickened by Foster Farms chicken over the last nine months or so.
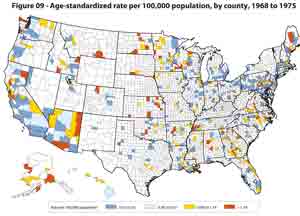
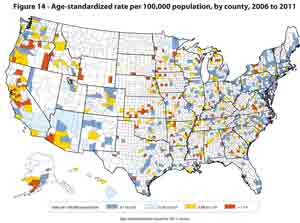
That maps in the atlas show the age-standardized rate by county over certain years. The years are not broken down by decade, or in even intervals- five groups of eight, for example, Instead, there is a map for 1968-1975, 1976-1983, 1984-1991, 1992-1998, 1999-2005 and 2006-2011. The two maps below show the concentration of Salmonella in 1968-1975 and 2006-2011. Blue is the lowest reported level, red is the highest.